

Final Reflections
Project Granite is coming to an end. It’s been great working with Scotland’s open data to take a closer look at communities. We have gained a lot of insights, but these were not always what we expected.

Published 22nd February 2022
Project Granite is coming to an end. It’s been great working with Scotland’s open data to take a closer look at communities. We have gained a lot of insights, but these were not always what we expected.
One of the previous blog posts in this series addressed the abundance of data-driven asset mapping projects in Scotland. We are still hearing of new projects and updates to current projects.
For example, New Philanthropy Capital have updated their interactive databank on charities and Covid-19, renaming it as “Local Needs Databank”. The databank now includes more data for Scotland, and it seems like it will be regularly updated as more data becomes available.
Another new project is the Office for National Statistics’ subnational indicators explorer. This tool allows users to view a range of open data about local authorities. The tool splits data into three main categories - ‘boosting living standards’, ‘spreading opportunity and improving public services’, and ‘restoring local pride’. They have framed these categories in terms of improving or shifting them rather than classifying places in terms of negative factors.
Projects like these are great for showcasing data and working towards stronger communities, but building a robust open data strategy is really important too. We can have better and more accurate tools with better open data.
Thanks for following along with the project, and thank you to everyone who has provided support and suggestions along the way. We will be releasing area insight profiles based on the data analysis and community conversations that we had as part of the Action Project soon.
New Year, New Data
I am continuing to analyse open data on Scottish communities. We couldn’t find some of the data that we wanted in an open source form, so we have been collecting it manually to add to the mapping.
Published 2nd February 2022
I am continuing to analyse open data on Scottish communities. We couldn’t find some of the data that we wanted in an open source form, so we have been collecting it manually to add to the mapping.
It’s been quite a journey. We’ve had some interesting conversations, including with Ian Watt of Open Data Scot and with Graham Hogg from Lateral North.
One hurdle that Ian pointed out is the blanket copyright statement on most local council websites, which prevents anything on their websites from being published. This means that we’ve had to collect information on community spaces from other places manually, such as Google - we had to improvise because of the lack of open data provision. With improvisation comes risk - the community spaces dataset may contain some information that is out of date.
Another hurdle is primary school data. We added it into the data mapping as primary schools are often a community hub of activity. However, upon including primary school locations on the maps, when we checked, we realised that the coordinates were not accurate enough. This meant that primary schools could appear in the wrong intermediate zone which affected the results.
There is a growing data community in Scotland and it has been fascinating getting to grips with it and learning about some of the benefits and challenges involved with working with open data.
We will be tracking the learning from this project in a forthcoming policy briefing on about open data and how far we have to go as a country to ensure we can use data to build a Scotland of better places.
Checking out other data projects
One of the aims of Project Granite is to produce insight into Scottish communities and places that does not already exist.
In order to make sure that we are not repeating others’ work, I have searched for similar projects that map features and services of Scottish places and communities. Thank you to everyone that shared links and referred us to other projects. I was really surprised by how many there were.
It is likely that I have not found them all, so if you know of a project that I have missed, please let me know. I have included a date and attribution statement where possible, and in other cases I have just linked to the relevant project.

Published 17th November 2021
One of the aims of Project Granite is to produce insight into Scottish communities and places that does not already exist.
In order to make sure that we are not repeating others’ work, I have searched for similar projects that map features and services of Scottish places and communities. Thank you to everyone that shared links and referred us to other projects. I was really surprised by how many there were.
It is likely that I have not found them all, so if you know of a project that I have missed, please let me know. I have included a date and attribution statement where possible, and in other cases I have just linked to the relevant project.
Summary
Some projects are quite general in their approach, whereas others take a very targeted view of the features of communities that they are mapping, and use only one or a small number of indicators. These projects all aim to map how communities are functioning, most with the aim of helping others to target interventions that can improve things in those communities.
I was astonished that there are so many data projects looking at communities from different perspectives which take on slightly different configurations of data but on the face of it have some overlap.
All of these tools take a great deal of time and expertise to produce, as well as in many cases secure funding or negotiate partnership agreements. A lot of this work would need to be repeated at regular intervals in order for the data to remain relevant and useful.
Each of these projects provides insight but more effort could be made to standardise outputs (particularly when within or funded by government) and make sure that these projects are widely known about to reduce the risk of wasting resources through duplication of effort.
Asset Mapping
Scotland's Economic Asset Register
This tool was developed by Scotland's Centre for Regional Inclusive Growth, with the aim of informing regional economic strategies. The tool allows you to view and filter companies, infrastructure, tourism, research, education, Companies House - Business Base, offshore assets, land use, population, and admin boundaries. It also has a data download feature for open datasets, which you can access by clicking the black arrow button at the bottom of the page. However, it is not clear whether the data that they have included is the most recent data available.
Hot Spots of Rural Resilience in Scotland, 2019-2020
This report1 was developed as part of a partnership between the National Centre for Resilience, Scotland's Rural College and The James Hutton Institute. The map shows distance to features that indicate community resilience (e.g. community centres, doctor surgeries) through a resilience score for each area. Alongside the map, a resilience indicators database2 was published, as well as the data generation code.3
2021 Legatum UK Prosperity Index
The Legatum Institute’s UK Prosperity Index4 ranks local authorities in terms of prosperity, as defined by numerous indicators. The methodology is available here. On the downloads page, users can find profiles for each local authority in Scotland by scrolling down, for instance here is the profile for Dundee City.
Understanding Scotland's Places (USP), 2018
This tool was developed by a consortium of organisations commissioned by the Scottish Government and led by the Carnegie UK Trust. The consortium includes Scotland’s Towns Partnership (STP), the Centre for Local Economic Strategies (CLES), and the University of Stirling. Users can select and compare towns on a range of indicators. Towns are ranked on a scale of independence, interdependence and dependence for each of the indicators.
The Community Wellbeing Index
This index produced by Co-op5 includes a tool that allows users to search a postcode and view information about the area including education, health, jobs, culture, transportation, housing, relationships/trust, equality and participation. There is also a mapping tool that shows local authorities or constituencies and associates their score with a colour, and a report that highlights the methodology.
Community business map
This map from the Plunkett Foundation has markers for community businesses across the UK, and you can filter on a range of community business types.
20 Minute Neighbourhoods in a Scottish Context
This mapping tool6 and report look at 20 minutes neighbourhoods, places where residents can access all the services they need (for instance, stewardship, civic, movement, resources, and spaces) within a 20 minute walk, cycle, or public transport journey from their homes. The accompanying map scores neighbourhoods by the percentage of people who live in a 20 minute neighbourhood.
Health and COVID-19
The ScotPHO Profiles
A mapping and data visualisation tool from the Scottish Public Health Observatory that includes both health determinants and health outcomes data, available at a range of geographical levels including health board area and local authority in tabular, graphical and map formats.
Covid 19 Building Community Resilience
Produced by Scotland’s Regeneration Forum (SURF), this mapping tool and report7 highlight the need for community resilience in an effective Covid-19 response as well as indicating some of the places where organisations have formed to support people affected by the pandemic.
Covid-19 Community Vulnerability
This mapping tool produced by ScotPHO uses a range of clinical, social, and demographic indicators to rank communities on vulnerability to Covid-19. Users can filter map view on council area, intermediate zone, and datazone level.
Isolation Plus, 2020
This tool, which was trialled in 2020 and produced/funded by the European Space Agency, Stevenson Astrostat Ltd, and Lanterne uses satellite technology to identify communities vulnerable to isolation in light of the Covid-19 pandemic. The tool is no longer available for use, but was in commercial development as of April 2021.
Interactive databank on charities and Covid-19
This databank8 produced by New Philanthropy Capital (NPC) allows users to visualise a range of statistics relating to the impact of Covid-19 on UK communities. Most of the datasets do not include Scotland, but one useful data source is a section for the British Gas Energy Trust which outlines the number and value of awards for each local authority as well as the percentage of households in fuel poverty for each local authority (2020-2021).
Community business map
This map from the Plunkett Foundation has markers for community businesses across the UK, and you can filter on a range of community business types.
COVID-19 Vulnerability Index
This tool from the British Red Cross includes a map where users can view a vulnerability score for each local authority area in the UK. The scores are calculated from four domains: clinical, health and wellbeing, economic, and social. More information is available here. Note: the map can take a while to load.
Data downloads for identifying areas with higher proportions of people at risk from Covid-19
This page from the Oxford Consultants for Social Inclusion (OSCI) contains an indicator list and Intermediate Zone data download for Scotland.
Third Sector
State of the Sector, 2020
This tool from SCVO visualises voluntary sector statistics from OSCR and SCVO, allowing users to view this data in a variety of forms. The tool also includes distribution of organisations by urban/rural code and SIMD quintile.
Community Funding dashboard
This dashboard includes a map and graphs, and allows users to select one or more local authority areas and view the total and per capita funding allocated by the Scottish Government to the area(s) in response to challenges posed by the Covid-19 pandemic.
360Giving
This tool from GrantNav allows users to visualise collection of grants data published by UK funders. You can filter by geography (local authority), year, amount, recipient, and funding organisation.
Other
Scottish Index of Multiple Deprivation, 2020
An interactive map and data download tool that allows users to view detailed statistics at datazone level. The technical report is available here.
Council Area Profiles, 2021
National Records of Scotland’s Council Area Profiles9 allow users to view detailed population data and trends for each council area, including population estimates, population projections, births, deaths, life expectancy, migration, marriages and civil partnerships, household projections, and dwellings. The tool allows users to compare one council area across multiple years, as well as against other council areas and Scotland as a whole.
Community Planning Outcomes Profile
Using this tool from the Improvement Service, which is still in development, users can select and compare a range of local authorities and community areas on a range of indicators of community wellbeing such as healthy birthweight, BMI, child poverty, attainment, positive destinations, employment rate, median earnings, out of work benefits, business survival, crime rate, dwelling fires, carbon emissions, emergency admissions, unplanned hospital attendances, early mortality, fragility, well-being, and fuel poverty. The data is also available for download. The producers of this tool acknowledge gaps in data on social inclusion/loneliness, community empowerment/resilience, early years development, emotional and physical wellbeing, and lived experience in local environments.
Brexit Vulnerability Index Map
This map from the Scottish Government and Rural and Environment Sciences and Analytical Services (RESAS) groups Data Zones into deciles based on their vulnerability to the consequences of Brexit. If you click on a Data Zone, you can view vulnerability scores for each domain.
Stat-Xplore
This tool from the Department for Work and Pensions allows users to view DWP benefit statistics as tables or on a map.
The State of our Social Fabric
By visiting Onward’s data visualisation page10 and selecting the "social fabric" filter, users can view a variety of Office for National Statistics data at local authority level. There is also an accompmanying report11, which includes an index that aims to build on/improve Legatum Institute’s Prosperity Index, Young Foundation’s Community Wellbeing Index, and Local Trust and OSCI’s analysis of left behind neighbourhoods.
1 John E Meador, Ruth Wilson, Mike Spencer, and Mags Currie. (2020). Hot Spots of Rural Resilience in Scotland. Zenodo. https://doi.org/10.5281/zenodo.3733112.
2 Michael Spencer, Elliot Meador, and Ruth Wilson. (2019). Identifying Hot Spots in Rural Community Resilience in Scotland - database [Data set]. Zenodo. https://doi.org/10.5281/zenodo.3386198 © Crown Copyright and Database Right 2019. Ordnance Survey (Digimap Licence). This material includes data licensed from PointX Database Right/Copyright 2019. Contains NRS data © Crown copyright and database right 2019. https://creativecommons.org/licenses/by-nc-sa/4.0/legalcode.
3 Michael Spencer. (2019). Identifying Hot Spots in Rural Community Resilience in Scotland - data generation code (v1.02). Zenodo. https://doi.org/10.5281/zenodo.3519006 https://opensource.org/licenses/GPL-3.0).
4 2021 Legatum UK Prosperity Index™ (https://li.com/reports/uk-prosperity-index-2021/).
5 © Co-operative Group Limited. All rights reserved.
6 Ramboll for ClimateXChange, 20 Minute Neighbourhood in the Scottish Context, 2021.
7 Elaine Cooper, SURF, September, 2020.
8 © 2021 Think NPC.
9 © Crown copyright, 2021. Data supplied by National Records of Scotland.
10 Copyright © Onward, Company Registration no. 11326052.
11 Tanner, W., O’Shaughnessy, J., Krasniqi, F. and Blagden, J., 2020. The State of our Social Fabric.
Using Python and pandas to get stuck in
This blog gives insights into the progress of Project Granite, which is research supported by the William Grant Foundation and my mentor from CodeClan.
IBy live blogging about the research, readers can come on the journey open data with us and ask questions along the way.
Published 7th October 2021
Hi, I’m Elmar Rollings, Data Analyst with the David Hume Institute.
This blog gives insights into the progress of Project Granite, which is research that I’m working on with support from the William Grant Foundation and my mentor from CodeClan.
I hope by live blogging about the research, readers will help connect me to even more open data and ask questions.
The aim of the project is to analyse and correlate open data about Scotland’s places, in order to better understand the bedrock of Scottish communities - their characteristics, local assets, patterns of resource allocation and potential unmet needs.
Data analysis is often enlightening but it should not be the only investigative method used when looking at communities. Rather, it can provide insights that can then be used to decide which areas merit further research on the ground.
One of the inspirations for this project was analysis of charity locations in England and Wales. The report found that the areas that might benefit most from charities contain relatively few.
There have been numerous projects to identify and provide insight to places and communities across the UK. Some projects focus on providing indexes and ranking, where weight might be given to factors relating to thriving communities such as community relationships and resilience, while others focus on more traditional indicators such as resident’s income and housing. This can mean that different communities are identified as those most in need of support, depending on which indicators are used, and how they are weighted.
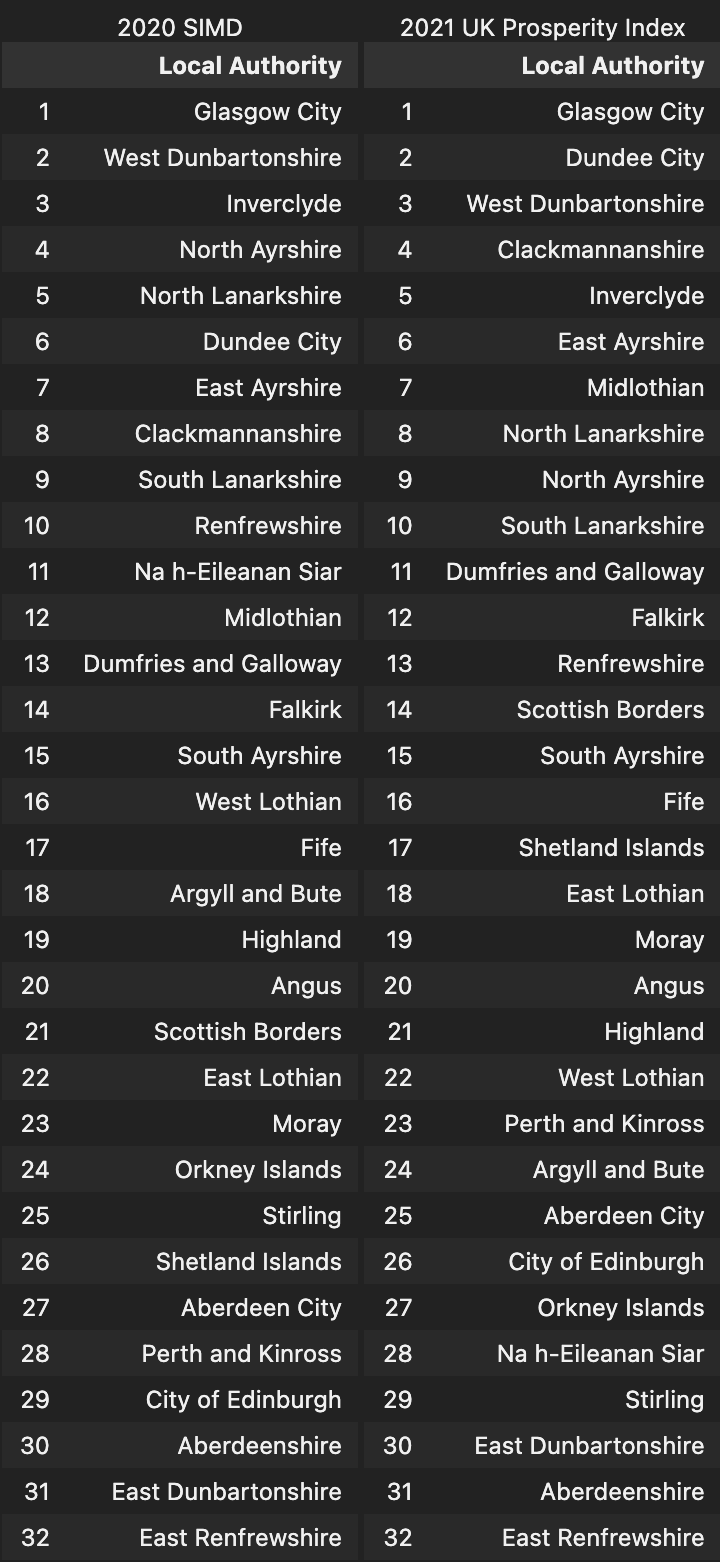
For example, I have looked at the 2020 Scottish Index of Multiple Deprivation (SIMD) rankings next to the 2021 Legatum UK Prosperity Index. which shows some interesting similarities and differences.
Sources:
2021 Legatum UK Prosperity Index™ (https://li.com/reports/uk-prosperity-index-2021/)
Scottish Index of Multiple Deprivation 2020, Scottish Government, 2020, licensed under the Open Government Licence (https://www.nationalarchives.gov.uk/doc/open-government-licence/version/3/)
My research will take an iterative approach to understanding what insights open data can provide about Scotland’s places, using a range of open datasets, including Scottish Government statistics, OSCR and previous work such as that which maps hot spots of rural resilience and economic assets in Scotland.
Questions that will be considered as part of the project (subject to suitable data being available):
How can data analysis best highlight patterns of resource allocation in Scotland and drive positive change in communities
Is there equal access across Scotland to social infrastructure (like community groups, village halls or mutual aid networks) which help improve wellbeing amongst residents?
Where are the gaps? Is there a postcode lottery in terms of services and assets? Which areas need targeted support to further improve community wellbeing?
Which features of Scottish life that help create thriving communities are not adequately captured in traditional metrics?
Getting started
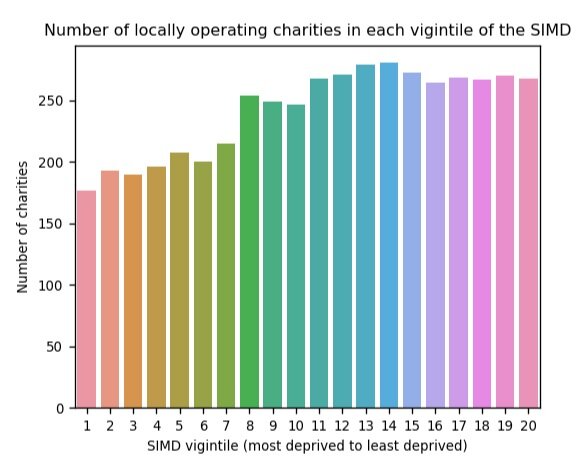
The presence of charities in a community can indicate a level of community activity. Using 2021 data from the Office of the Scottish Charity Regulator (OSCR), I have analysed the locations of Scottish charity head offices for charities that state that they operate in one community or local authority. Similarly to the 2020 state of the sector analysis from SCVO, I have correlated of charity locations with SIMD rankings but I’ve used a broader range of organisations types such as churches which are excluded from the SCVO analysis.
So far, I’ve been using Python and pandas in Jupyter Notebooks to do the analysis. The figure below is an example of some of the work that I’ve done.
Sources:
Scottish Index of Multiple Deprivation 2020, Scottish Government, 2020, licensed under the Open Government Licence, (https://www.nationalarchives.gov.uk/doc/open-government-licence/version/3/) contains information from the Scottish Charity Register supplied by the Office of the Scottish Charity Regulator and licensed under the Open Government Licence v.3.0. (http://www.nationalarchives.gov.uk/doc/open-government-licence/version/3/)
It appears that charity head offices are concentrated in the middle and higher bands of the SIMD, with the most deprived areas (as defined by the SIMD) having fewer charities based in them. However, a charity’s head office location is not necessarily indicative of where it operates.
This simple correlation is a start to understanding that the most interesting insights are likely to be at data zone rather than local authority level. Although OSCR’s data also contains a ‘main operating location’, this is based at local authority level rather than datazone level.
So we are reaching out to lots of people to ask - what data is available that is open source and will give insight into communities and their resources at datazone level?
Next instalment coming soon - more open data analysis and insights.