
Using Python and pandas to get stuck in

Published 7th October 2021
Hi, I’m Elmar Rollings, Data Analyst with the David Hume Institute.
This blog gives insights into the progress of Project Granite, which is research that I’m working on with support from the William Grant Foundation and my mentor from CodeClan.
I hope by live blogging about the research, readers will help connect me to even more open data and ask questions.
The aim of the project is to analyse and correlate open data about Scotland’s places, in order to better understand the bedrock of Scottish communities - their characteristics, local assets, patterns of resource allocation and potential unmet needs.
Data analysis is often enlightening but it should not be the only investigative method used when looking at communities. Rather, it can provide insights that can then be used to decide which areas merit further research on the ground.
One of the inspirations for this project was analysis of charity locations in England and Wales. The report found that the areas that might benefit most from charities contain relatively few.
There have been numerous projects to identify and provide insight to places and communities across the UK. Some projects focus on providing indexes and ranking, where weight might be given to factors relating to thriving communities such as community relationships and resilience, while others focus on more traditional indicators such as resident’s income and housing. This can mean that different communities are identified as those most in need of support, depending on which indicators are used, and how they are weighted.
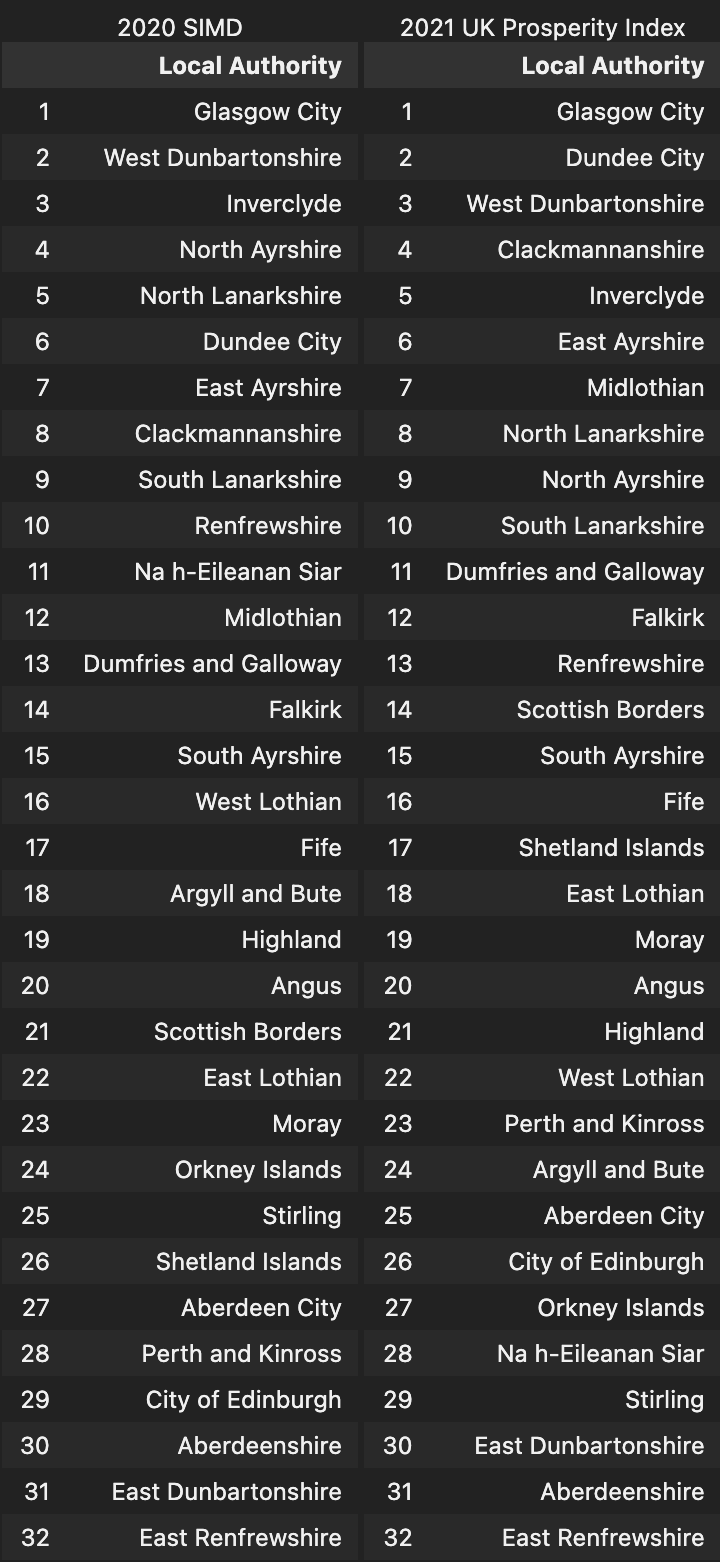
For example, I have looked at the 2020 Scottish Index of Multiple Deprivation (SIMD) rankings next to the 2021 Legatum UK Prosperity Index. which shows some interesting similarities and differences.
Sources:
2021 Legatum UK Prosperity Index™ (https://li.com/reports/uk-prosperity-index-2021/)
Scottish Index of Multiple Deprivation 2020, Scottish Government, 2020, licensed under the Open Government Licence (https://www.nationalarchives.gov.uk/doc/open-government-licence/version/3/)
My research will take an iterative approach to understanding what insights open data can provide about Scotland’s places, using a range of open datasets, including Scottish Government statistics, OSCR and previous work such as that which maps hot spots of rural resilience and economic assets in Scotland.
Questions that will be considered as part of the project (subject to suitable data being available):
How can data analysis best highlight patterns of resource allocation in Scotland and drive positive change in communities
Is there equal access across Scotland to social infrastructure (like community groups, village halls or mutual aid networks) which help improve wellbeing amongst residents?
Where are the gaps? Is there a postcode lottery in terms of services and assets? Which areas need targeted support to further improve community wellbeing?
Which features of Scottish life that help create thriving communities are not adequately captured in traditional metrics?
Getting started
The presence of charities in a community can indicate a level of community activity. Using 2021 data from the Office of the Scottish Charity Regulator (OSCR), I have analysed the locations of Scottish charity head offices for charities that state that they operate in one community or local authority. Similarly to the 2020 state of the sector analysis from SCVO, I have correlated of charity locations with SIMD rankings but I’ve used a broader range of organisations types such as churches which are excluded from the SCVO analysis.
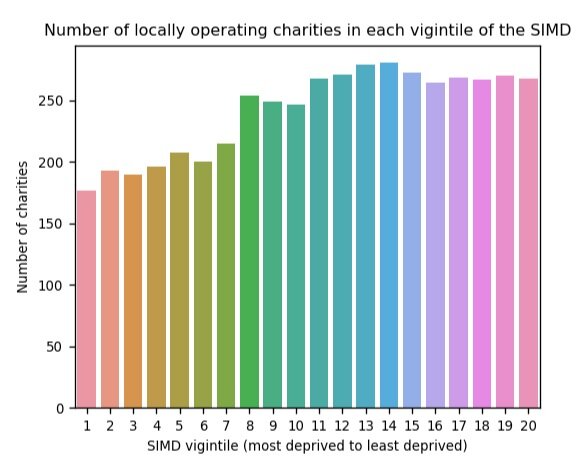
So far, I’ve been using Python and pandas in Jupyter Notebooks to do the analysis. The figure below is an example of some of the work that I’ve done.
Sources:
Scottish Index of Multiple Deprivation 2020, Scottish Government, 2020, licensed under the Open Government Licence, (https://www.nationalarchives.gov.uk/doc/open-government-licence/version/3/) contains information from the Scottish Charity Register supplied by the Office of the Scottish Charity Regulator and licensed under the Open Government Licence v.3.0. (http://www.nationalarchives.gov.uk/doc/open-government-licence/version/3/)
It appears that charity head offices are concentrated in the middle and higher bands of the SIMD, with the most deprived areas (as defined by the SIMD) having fewer charities based in them. However, a charity’s head office location is not necessarily indicative of where it operates.
This simple correlation is a start to understanding that the most interesting insights are likely to be at data zone rather than local authority level. Although OSCR’s data also contains a ‘main operating location’, this is based at local authority level rather than datazone level.
So we are reaching out to lots of people to ask - what data is available that is open source and will give insight into communities and their resources at datazone level?
Next instalment coming soon - more open data analysis and insights.